Upload date
All time
Last hour
Today
This week
This month
This year
Type
All
Video
Channel
Playlist
Movie
Duration
Short (< 4 minutes)
Medium (4-20 minutes)
Long (> 20 minutes)
Sort by
Relevance
Rating
View count
Features
HD
Subtitles/CC
Creative Commons
3D
Live
4K
360°
VR180
HDR
43 results
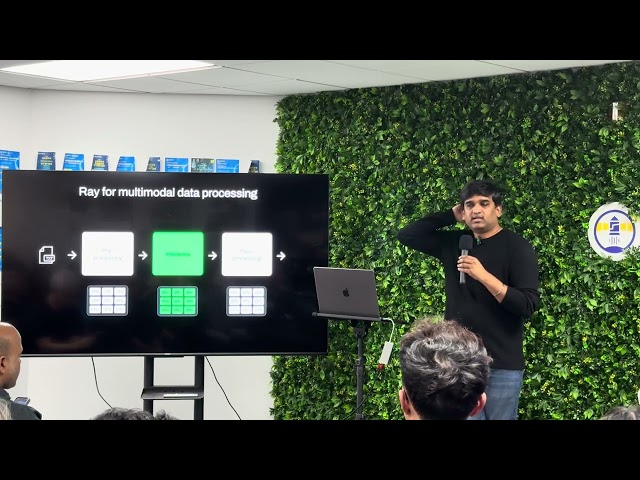
In this technical deep dive, Suman Debnath from Anyscale explores why Ray has become the industry standard for scaling AI ...
224 views
9mo ago
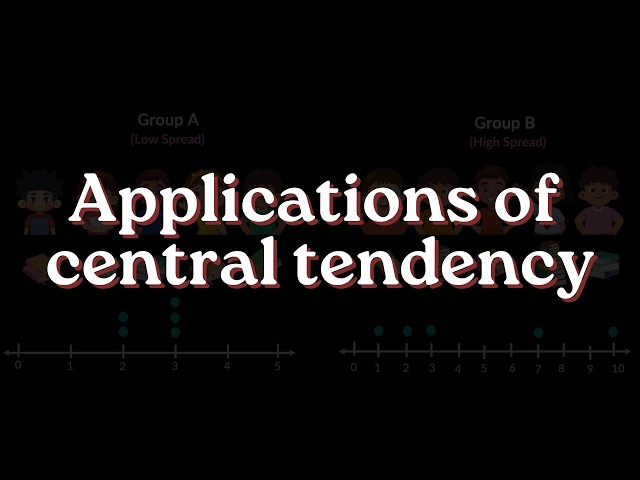
Explore how dot plots, mean, and median help us understand and compare real-life data. Learn to analyze patterns, variability, ...
142 views
5mo ago
Karen Sheng, Chief Product Officer @ AIsaIn this session from the Data for AI meetup, demonstrates how to empower developers ...
37 views
Dmitry Anoshin from Surfalytics addresses a subscriber's question about the future of data jobs in the age of AI. He discusses the ...
347 views
2y ago
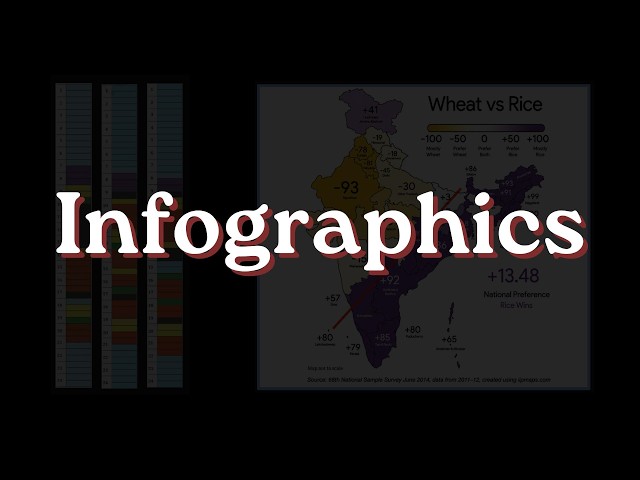
In this video, we will learn about infographics and understand how they help present information in a clear and visually appealing ...
252 views
3mo ago
Never before have we had such a rich collection of satellite imagery available to both companies and the general public. Between ...
21 views
In this video, we will learn how to represent and interpret data using line graphs. We will understand the different components of a ...
301 views
Data Bite: Ever wondered what the difference between graph, plot, and chart is? Or even if there is a difference? Check this quick ...
33 views
3y ago